C言語で簡易関数トレース
シンプルなprintf()デバッグをコンパイルスイッチでON/OFFできるように実装する。
trace.c
#include <stdio.h>

#ifdef DEBUG_ENABLE
#define ENTRANCE(fmt, ...) \
    printf("%s:%u:===> IN  %s(" fmt ")\n", __FILE__, __LINE__, __func__, ##__VA_ARGS__);
#else
#define ENTRANCE(fmt, ...)
#endif /* DEBUG_ENABLE */

#ifdef DEBUG_ENABLE
#define EXIT(fmt, ...) \
    printf("%s:%u:<=== OUT %s(" fmt ")\n", __FILE__, __LINE__, __func__, ##__VA_ARGS__);
#else
#define  EXIT(fmt, ...)
#endif /* DEBUG_ENABLE */

#ifdef DEBUG_ENABLE
#define LOG_DEBUG(fmt, ...) \
    printf("%s:%u:%s():  " fmt "\n", __FILE__, __LINE__, __func__, ##__VA_ARGS__);
#else
#define LOG_DEBUG(fmt, ...)
#endif /* DEBUG_ENABLE */

int function(int a)
{
    int ret = 0;
    ENTRANCE("a=%d", a);

    EXIT("ret=%d", ret);
    return ret;
}

int main(void)
{
    ENTRANCE();

    LOG_DEBUG("hello world");

    int a = 1;
    int b = 2;
    LOG_DEBUG("a + b = %d", a+b);

    function(a);

    EXIT();
    return 0;
}
実行例
$ gcc -DDEBUG_ENABLE trace.c
$
$ ./a.out
trace.c:35:===> IN  main()
trace.c:37:main():  hello world
trace.c:41:main():  a + b = 3
trace.c:27:===> IN  function(a=1)
trace.c:29:<=== OUT function(ret=0)
trace.c:45:<=== OUT main()
$
あくまで簡易的なのでソースコードの規模が大きくなるほど見にくくなる予感。
trace.c:35:===> IN  main()
trace.c:27:  ===> IN  function(a=1)
trace.c:29:  <=== OUT function(ret=0)
trace.c:45:<=== OUT main()
こんな感じで、関数のIN/OUTでスタックが深くなるにしたがって表示が右にシフトしていくような機能が欲しい。
後は、タイムスタンプとsyslogのようにログレベルを指定してログの出力量を調整できる機能を追加したい。
コードの処理速度計測にgprofを試してみた
GNUのプロファイラ gprofでコードの処理速度計測を試してみた。
関数単位、LINE(行)単位での実行速度の計測ができる模様。
今回は関数単位でお試し。
使い方は"-pg"のオプションを付与してコンパイルしたバイナリを実行後にgprofコマンドをかませばOK。
gproftest.c
#include <stdio.h>
#include <stdlib.h>
#include <string.h>
#include <unistd.h>

#define LOOP_BASE_COUNT (100*1000)

void function1(void)
{
    char buf1[1024] = {0};
    char buf2[1024] = {0};

    /* メモリ操作で負荷をかける */
    for(int i = 0; i < LOOP_BASE_COUNT; i++) {
        memset(buf1, 0xff, sizeof(buf1));
        memcpy(buf2, buf1, sizeof(buf2));
    }
}

void function2(void)
{
    char buf1[1024] = {0};
    char buf2[1024] = {0};

    for(int i = 0; i < LOOP_BASE_COUNT*10; i++) {
        memset(buf1, 0xff, sizeof(buf1));
        memcpy(buf2, buf1, sizeof(buf2));
    }
}

void function3(void)
{
    char buf1[1024] = {0};
    char buf2[1024] = {0};

    for(int i = 0; i < LOOP_BASE_COUNT*1000; i++) {
        memset(buf1, 0xff, sizeof(buf1));
        memcpy(buf2, buf1, sizeof(buf2));
    }
}

int main(void)
{
    function1();
    function2();
    function3();

    return 0;
}
$ cat Makefile
gproftest: gproftest.c
        gcc -O2 -pg -std=gnu99 -o gproftest gproftest.c
実行例
$ make
gcc -O2 -pg -std=gnu99 -o gproftest gproftest.c
$
$ time ./gproftest

real    0m10.355s
user    0m10.341s
sys     0m0.004s
$
$
$ gprof gproftest gmon.out
Flat profile:

Each sample counts as 0.01 seconds.
  %   cumulative   self              self     total
 time   seconds   seconds    calls   s/call   s/call  name
 99.88     10.31    10.31        1    10.31    10.31  function3
  0.98     10.41     0.10        1     0.10     0.10  function2
  0.00     10.41     0.00        1     0.00     0.00  function1
...(後略)...
[その他]
どうやらコンパイル時に -O3 で最適化すると上手くいかないぽい。
linuxでkbhit()
kbhit.h
#ifndef _KBHIT_H_
#define _KBHIT_H_

#include <stdbool.h>
#include <termios.h>
#include <unistd.h>

extern void KB_open(void);
extern void KB_close(void);
extern bool kbhit(void);
extern char linux_getch(void);


#endif /* _KBHIT_H_ */
kbhit.c
#include "kbhit.h"

static struct termios Old_set;
static struct termios New_set;
static int ReadChar = -1;

void KB_open()
{
    tcgetattr(0,&Old_set);
    New_set = Old_set;
    New_set.c_lflag &= ~ICANON;
    New_set.c_lflag &= ~ECHO;
    New_set.c_lflag &= ~ISIG;
    New_set.c_cc[VMIN] = 0;
    New_set.c_cc[VTIME] = 0;
    tcsetattr(0,TCSANOW,&Old_set);
}

void KB_close()
{
    tcsetattr(0,TCSANOW, &Old_set);
}

bool kbhit()
{
    char ch;
    int nread;

    if(ReadChar !=-1) {
        return true;
    }

    New_set.c_cc[VMIN]=0;
    tcsetattr(0,TCSANOW,&New_set);
    nread=read(0,&ch,1);
    New_set.c_cc[VMIN]=1;
    tcsetattr(0,TCSANOW,&New_set);

    if(nread == 1) {
        ReadChar = ch;
        return true;
    }

    return false;
}

char linux_getch()
{
    char ch;

    if(ReadChar != -1) {
       ch = ReadChar;
       ReadChar = -1;
       return (ch);
    }

    read(0,&ch,1);
    return(ch);
}
main.c
#include <stdio.h>
#include <stdlib.h>
#include <unistd.h>

int main(void)
{
    KB_open();

    while(1) {
        if (kbhit()) {

            char ch = linux_getch();

            printf("kbhit: %c\n", ch);

            if ('q' == ch) {
                break;
            }
        }

        usleep(10000);
    }

    KB_close();
}
kbloop: kbhit.o main.o
        gcc -o kbloop kbhit.o main.o

kbhit.o: kbhit.h kbhit.c
        gcc -c kbhit.c

main.o: main.c
        gcc -c main.c

clean:
        rm -f *.o
実行例
$ make
gcc -c kbhit.c
gcc -c main.c
gcc -o kbloop kbhit.o main.o
$
$ ./kbloop
kbhit: a
kbhit: b
kbhit: c
kbhit: d
kbhit: e
kbhit: f
kbhit: g
kbhit: q
$
$
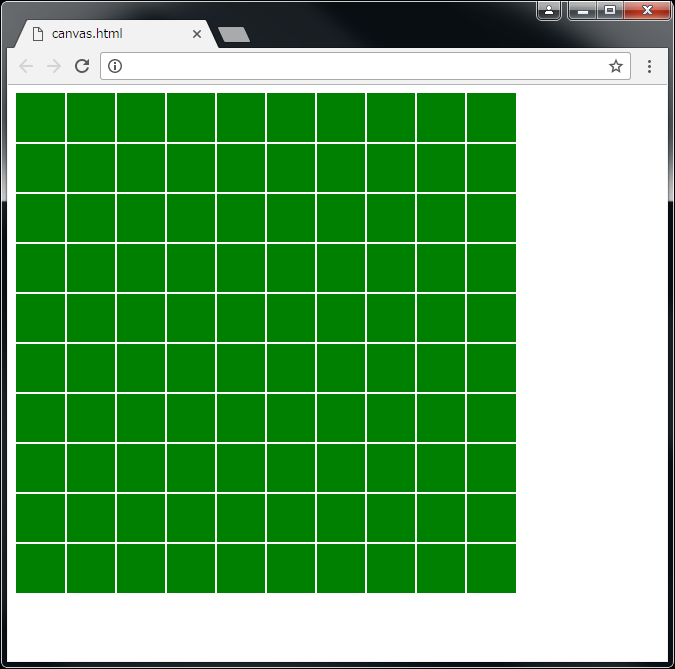
HTML,JavaScriptで格子を描画
canvas.html
<!DOCTYPE html>
<html>
<head>
  <meta charset="UTF-8">
</head>

<body>
  <!-- キャンバスの設定 -->
  <canvas id="canv" width="500" height="500"></canvas>
  <script>
    var ctx = document.getElementById("canv").getContext('2d');

    // 描画内容を指定する
    // 背景を500×500の緑で描画
    ctx.fillStyle = "rgb(0,128,0)";
    ctx.fillRect(0, 0, 500, 500);

    // 格子の設定
    ctx.strokeStyle = "white"
    ctx.lineWidth = 2;
    ctx.beginPath();

    // 縦線
    for (var v = 50; v < 500; v+=50) {
      ctx.moveTo(v, 0);
      ctx.lineTo(v, 500);
    }

    // 横線
    for (var h = 50; h < 500; h+=50) {
      ctx.moveTo(0, h);
      ctx.lineTo(500, h);
    }

    // 描画内容を実行する
    ctx.stroke();
  </script>

</body>

</html>
実行例

C言語でbuffer overrun
お呼びでない関数を実行する。
overrun.c
#include <stdio.h>
#include <stdlib.h>

void goast(void)
{
    printf("Boo!\n");
}

void dummy(void)
{
    char a[1] = {0};

    a[9] = &goast;
}

int main(void)
{
    dummy();
    return 0;
}
実行例
$ gcc overrun.c
overrun.c: In function 'dummy':
overrun.c:13: warning: assignment makes integer from pointer without a cast
$ ./a.out
Boo!
Segmentation fault
HTML,JavaScriptでブラウザに時刻表示
HTML, JavaScriptの最初の一歩と言えばコレ。
[仕様]
- 左上に現在時刻を"HH:MM:SS"形式で表示。'ex) 19:02:34'
index.html
<!DOCTYPE html>
<html>
<head>
<meta charset="utf-8" />
</head>
<body>
    <div id="disp" style="font-size:48px;text-align:left;"></div>
    <script>
        setInterval(showTime, 500);
        function showTime() {
            var tv = new Date();
            $("disp").innerHTML  =
                ("0" + tv.getHours()).slice(-2) + ":" +
                ("0" + tv.getMinutes()).slice(-2) + ":" +
                ("0" + tv.getSeconds()).slice(-2);
        }

        function $(id) { return document.getElementById(id); }
    </script>
</body>
</html>
gnuplotで正規分布を表示
gnuplotで正規分布のグラフをterminal上に表示する。環境はLinux(CentOS 6)
[手順]
事前準備(perl, gnulpotのinstall)
$ sudo yum -y install gnuplot
$ sudo yum -y install perl
#!/usr/bin/perl

$Pi = 3.14159265359;

$input = 1.0;
$sigma = 0.01;
$count = 10000;

while ($count > 0) {
    printf("%lf\n", RandBoxMuller($input, $sigma));
    $count--;
}

sub RandBoxMuller {
    my ($m, $sigma) = @_;
    my ($r1, $r2) = (rand(), rand());

    while ($r1 == 0) { $r1 = rand(); }

    return ($sigma * sqrt(-2 * log($r1)) * sin(2 * $Pi * $r2)) + $m;
}
reset

# set parameters
interval=100
min=0.950
max=1.050
width=(max-min)/interval

#function used to map a value to the intervals
hist(x,width)=width*floor(x/width)+width/2.0
set terminal dumb
set xrange [min:max]
set yrange [0:500]
set xtics min,(max-min)/5,max
set boxwidth width*0.9
set style fill solid 0.5 #fillstyle
set tics out nomirror
set xlabel "x"
set ylabel "Frequency"

#calculate and plot
plot "test.dat" u (hist($1,width)):(1.0) smooth freq w boxes
実行用シェルスクリプト
show_histgram.sh
#!/bin/sh

/usr/bin/perl ./ndist.pl > test.dat
/usr/bin/gnuplot plothist.gp
実行結果
$ ./show_histgram.sh


  Frequency
    500 ++------------------------------------------------------------------+
         |                       "test.dat" u (hist($1,width)):(1.0) ****** |
         |                                                                  |
         |                               ***                                |
    400 ++                               *****                              |
         |                             ********                             |
         |                            *********                             |
    300 ++                           ************                           |
         |                          *************                           |
         |                          ***************                         |
         |                         ****************                         |
    200 ++                        ******************                        |
         |                       *********************                      |
         |                      ***********************                     |
    100 ++                     ************************                     |
         |                    ***************************                   |
         |                  *******************************                 |
         |               ************************************               |
      0 ++--------*-************************************************-*------+
         +            +             +            +             +            +
        0.95         0.97          0.99         1.01          1.03         1.05
                                          x
$